Measuring Redshifts
Spectral Features
A very useful tool in the study of far away galaxies is a spectrometer, an instrument that allows us to measure a spectrum, or the brightness of our light source at each wavelength. Due to the cool nature of quantum mechanics (click here for more info), each element in the periodic table can only absorb or emit energy at specific wavelengths, which translates to distinct patterns in each element’s spectrum. We call these patterns spectral features. Even galaxies that are 9 billion light years away have element footprints we can see using a spectrometer here on Earth. In the MOSDEF survey we use MOSFIRE, a multi-object near-infrared spectrometer on the Keck I Telescope in Hawaii to measure spectra of galaxies between 9.5 and 12.5 billion light years away.
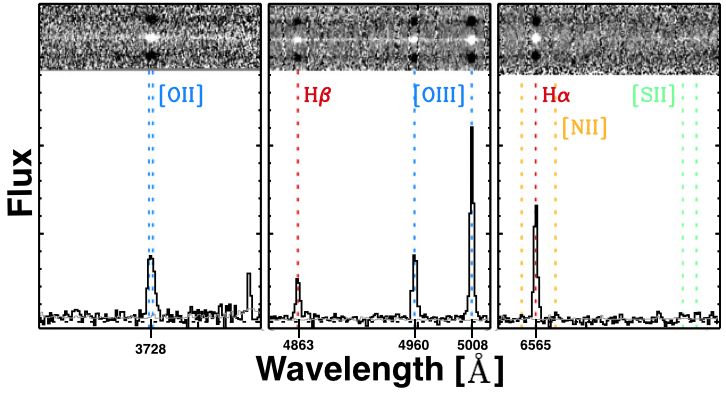
There are a few spectral features that are especially important in MOSDEF galaxies. One such feature is Hα which can be found in the red part of the visible spectrum. This line arises when massive bright stars we call O type stars ionize the hydrogen gas around them. This means that the energetic photons they emit strip the molecular hydrogen in the surrounding gas of its electrons, thereby ionizing the gas. This ionized gas then recombines with free electrons to form atomic Hydrogen. This process emits energy which we see as a spike in our spectrum. For more prominent lines that arise once electrons and ions recombine see the example MOSDEF galaxy spectral features shown in figure 1.
Not all galaxies have emission features in their spectra, so instead of using spectral features arising from interstellar gas, we use the stars themselves. Stellar atmospheres exhibit absorption features, or dips, in their individual spectra indicative of their temperature and chemical composition. We can use these element footprints to study a given galaxy in lieu of, or conjunction with, the emission features shown in figure 1.
The Cosmological Redshift
In the MOSDEF survey we use the spectral features described above for a myriad of science goals, ranging from determining stellar birth rates to studying stellar motion within these early galaxies, but first we have to figure out how far away they are! Though the element footprints described above retain the same pattern irrespective of how far away our light source is, a galaxy billions of light years away will have this pattern, but shifted to longer wavelengths. This occurs due to a phenomenon called the Cosmological Redshift.
The cosmological redshift is a stretching of light waves from distant sources due to the expansion of the Universe. When we see light from a galaxy 12 billion light years away, it means that the light wave we observed had to have been emitted 12 billion years ago, or approximately 2 billion years after the Big Bang. As the universe is expanding with time, the space through which the emitted light wave travels to get to Earth is itself stretching, meaning the light wave stretches as well. The further away a source is from Earth, the more time space has to expand between when the light wave is first emitted and when we observe it.
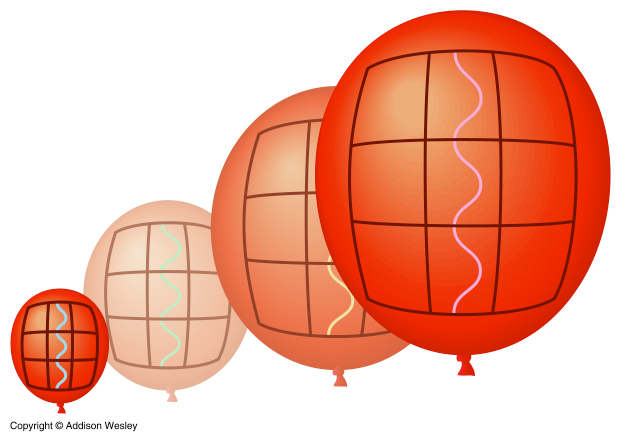
We can try to envision this effect by thinking of the Universe as an expanding balloon with waves drawn on it in marker (see figure 2). As we blow up the balloon, our drawn-on waves will stretch as the space of our balloon expands. The wavelengths of our drawn on squiggles will always be longer once our balloon is blown up than they were when we first drew them. These squiggles are directly analogous to light waves emitted in the early universe stretching as the Universe (balloon) expands with time. We can see that as our balloon Universe expands, the distance between the crests of our ‘light waves’—what we call their wavelength—increases. Putting this all together: the further away a light source is from Earth, the more space expands between when the light wave is first emitted and when we observe it, the longer its observed wavelength is relative to the wavelength it was emitted in, and the larger its redshift.
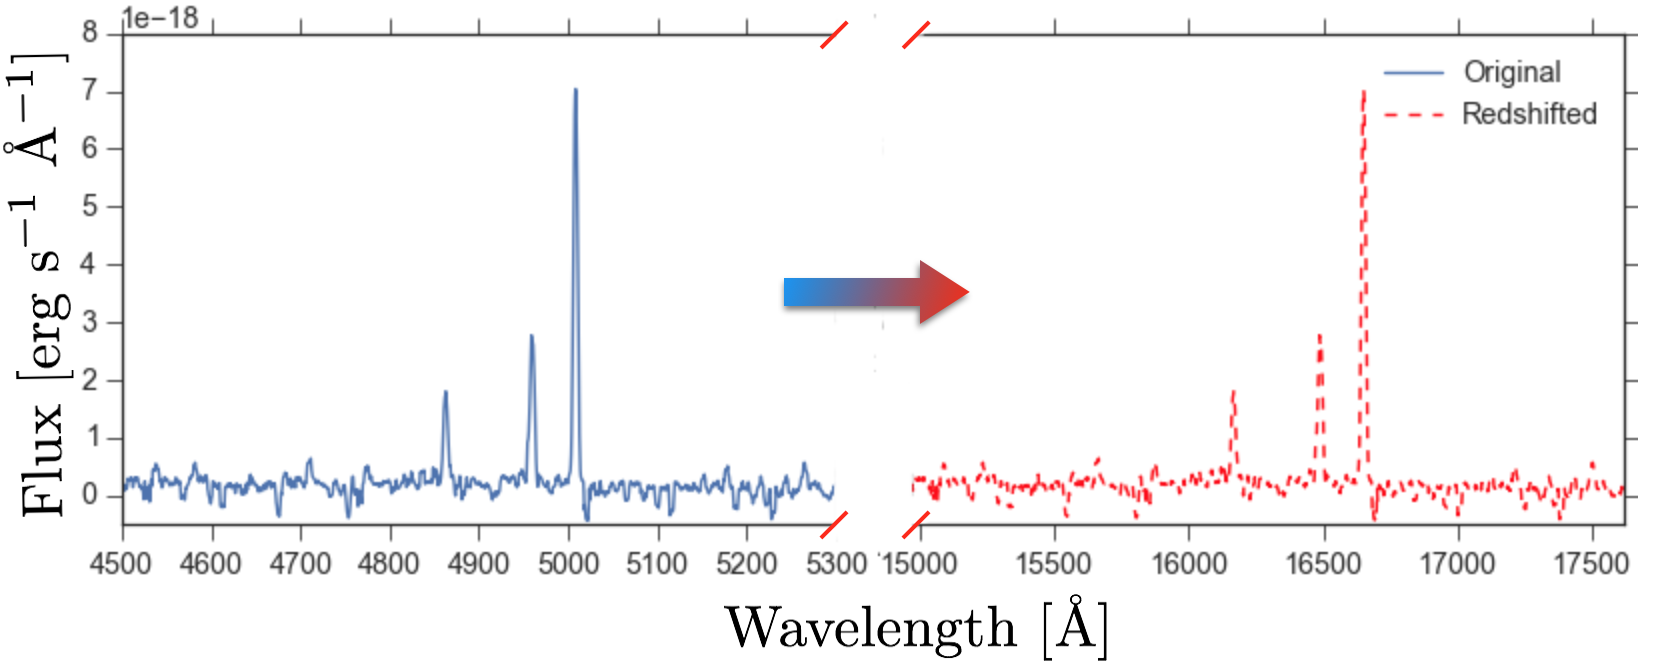
Taking advantage of this effect, we can find the familiar patterns in our spectral features, see how much they are shifted from the wavelengths we would expect to see them at for a nearby source, and measure a redshift. We can do this using the simple relation:
λem = λobs/(1+z)
where λem is the original wavelength corresponding to the spectral feature, λobs is the wavelength we observe the spectral feature at here on earth, and z is the redshift we measure. With the MOSDEF survey, we observe light from galaxies with redshifts between 1.37 and 3.8, which means our galaxies’ spectral features are shifted to longer wavelengths by factors ranging from 2.37 to 4.8. Therefore, even though the spectral features outlined in figures 1 and 2 correspond to wavelengths in the optical part of the spectrum, the Cosmological Redshift shifts them into the near infrared part of the spectrum. We therefore need to utilize a near infrared spectrometer like MOSFIRE to observe these spectral features in MOSDEF galaxies.
How Far Away?
The MOSDEF redshifts correspond to when the Universe was 1.5-4.5 Billion years old. Once we determine our galaxies’ redshifts and accordingly how old the Universe was when their light was emitted, we can begin to do some incredibly exciting science. Measuring redshifts as accurately as we do in the MOSDEF survey allows us to learn a lot about galaxies and how they evolve over time. Explore the rest of our science pages to learn more!