Physical Properties
What can emission lines tell us about star-forming regions in galaxies?

The strength of different emission lines can tell us about the properties of star-forming regions. Figure 1 shows an image of a star-forming region from a nearby galaxy. These regions are also referred to as HII (pronounced “H-two”) regions. HII regions consist of two main parts: a cluster of young, recently formed stars, some of which are very massive and hot, and a cloud of gas surrounding these stars. “HII” is shorthand for ionized (missing one electron) hydrogen, since the massive, hot stars emit ultraviolet radiation that ionizes atoms in the gas. The gas in HII regions exists in a state in which it will produce emission lines that can tell us about the physical properties of the HII region. Spectra of HII regions are shown in Figure 3 below.
The strongest lines in the visible wavelength range are highlighted. There are two lines from hydrogen: Hα at 6563 Å and Hβ at 4861 Å. These lines are produced when the missing electron of an ionized hydrogen atom recombines and the electron cascades down from higher to lower energy levels. Specifically, these features are part of what we call the “Balmer Series,” where the electron drops from upper levels into the first excited state.
In addition, there are several strong features from ionized states of elements that are heavier than hydrogen – i.e., the elements astronomers refer to as “metals.” These emission lines from metal ions are produced when a collision between the ion and an electron elevates the ion into an excited state. De-excitation to the ground state results in the emission of a photon. There are two lines from singly-ionized oxygen ([OII]) at 3726 Å and 3729 Å and two lines from doubly-ionized oxygen ([OIII]) at 4959 Å and 5007 Å. There are two lines from singly-ionized nitrogen ([NII]) at 6548 Å and 6584 Å. There are also two lines from singly-ionized sulfur ([SII]) at 6716 Å and 6731 Å. This list only contains the strongest emission lines; an HII region spectrum contains many weaker lines as well. When observing high redshift galaxies, only the strongest emission lines are bright enough to be observed. The strengths of these different emission lines tell us about the properties of the HII region, including the density of the gas and the number of metals (elements heavier than hydrogen and helium) in the gas, called metallicity.
Density
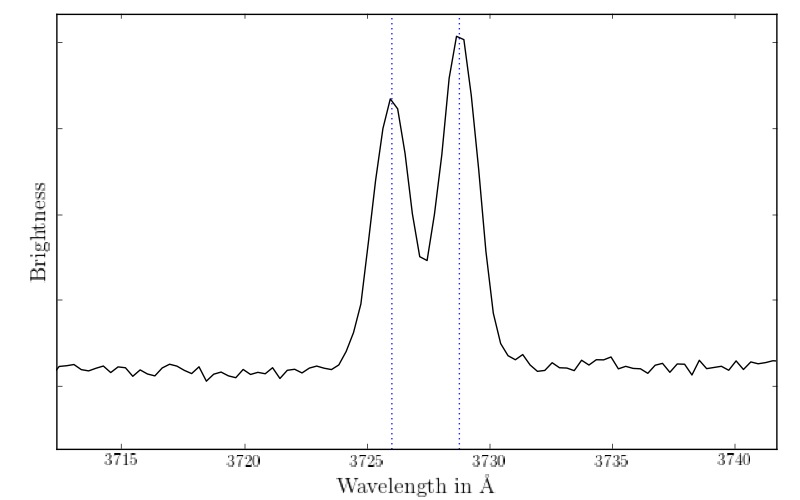
The [OII] and [SII] emission lines can be used to determine the density of the hydrogen gas. There are two [OII] emission lines that almost have the same wavelength, and two [SII] emission lines that are also close in wavelength. We call these pairs of lines doublets. The ratio of the two lines in the [OII] or [SII] doublet changes with the density of the gas. If the gas is denser, the [OII] line at 3729 Å decreases in strength compared to the one at 3726 Å. Similarly, the [SII] line at 6716 Å is weaker compared to the one at 6731 Å when the gas becomes denser. Figure 2 shows a zoomed-in spectrum of an [OII] doublet from a low-density HII region. The density measured from these doublet ratios is actually the density of the electrons, not the hydrogen gas, but since the hydrogen gas is ionized (missing an electron) in an HII region, the density of free electrons is nearly equal to the density of the gas. The typical density in HII regions in the local universe is about 30 electrons per cubic centimeter. It looks like the density in high-redshift HII regions is about 10 times higher than the local value, approximately 250 electrons per cubic centimeter.
Metallicity
![Figure 4. Spectrum of a high-metallicity (top) and low-metallicity (bottom) HII region. When the metallicity of the gas is low, the strength of the [OIII] and [OII] lines is greater compared to that of Hα, while the strength of the [NII] and [SII] lines decreases.](http://mosdef.astro.berkeley.edu/wp-content/uploads/2015/12/combined_hii_region_spectrum.png)
The relative strengths of the emission lines produced in HII regions can be used to estimate the metallicity of the gas. Metallicity is a term that refers to the number of atoms of heavy elements (heavier than helium on the periodic table) compared to the number of hydrogen atoms. After the Big Bang, the only elements that existed were hydrogen, helium, and an extremely tiny amount of lithium. Virtually all of the other chemical elements that exist today were created in the cores of stars through nuclear fusion of hydrogen and helium, or in supernova explosions that are the deaths of massive stars. Because hydrogen and helium were the only elemental building blocks that existed after the Big Bang, astronomers refer to all elements that are heavier as “metals.” This terminology is different from the way chemists define metals.
For galaxies and HII regions, we commonly measure the abundance of oxygen with respect to hydrogen, O/H. The strength of the emission lines relative to each other depend on the oxygen abundance. HII regions that are metal-rich will have weak [OIII] compared to Hβ and strong [NII] and [SII] compared to Hα, while galaxies that have few metals will have strong [OIII] compared to Hβ and very weak [NII] and [SII]. The buildup of heavy elements over the history of the universe is of critical importance to the formation of planets and existence of life. Figure 3 shows examples of low-metallicity and high-metallicity HII region spectra. Compare the two spectra to see how the relative strengths of emission lines change with metallicity. High-redshift galaxies typically have lower metallicities than galaxies in the local universe with the same stellar mass.
Other physical properties
The emission lines from star-forming regions can tell us other interesting information. We can determine a property called the ionization parameter, which is related to how much of a certain element is in different ionic states (i.e. how much oxygen is singly-ionized vs. twice-ionized). The ionization parameter can also let us infer the geometric distribution of gas around the hot stars. We can also learn things about the hot, young stars from the emission lines. Stars with different properties will cause the gas to produce different emission line strengths.
These same emission lines can give other information about galaxies, including their rates of star formation, dust properties, and the activity of the massive black holes at the centers of galaxies. Emission lines also allow us to determine how far away a galaxy is from the earth using its redshift.